You already know that successful stock investors buy shares when they trade below their fair price and earn money as they correct up to their real value. The question is what it this “fair Price†and how is it determined? Is a share traded at a $2 cheaper than a $100,000 stock? Does the stock of a company that earns $1 per share every year is worth more than its competitor who earns 1 cent per share?
A stock is not just a piece of paper with an arbitrary price tag. Holding a share is equivalent to partial ownership of the company itself. Therefore, the real price of a stock is equivalent to its relative share of the company’s fair value (sometimes also called Intrinsic Value). In other words, the real price of one share will be equal to the fair value of the company divided by the total number of its shares outstanding. For example, if the fair value of Caterpillar (CAT) is $60 billion and it has 600 million shares outstanding, then the real price of its stock is $100. When CAT is traded below $100 it is considered undervalued (“cheapâ€) and is attractive to be bought, and above $100 the stock is overvalued (“expensiveâ€) thus you should wait for a better entry price.
So, all we need to know is how to value the company itself. There are three main techniques for doing that – Net Asset Valuation, relative valuation using multiples, and Discount Cash Flow valuation, which is the most reliable technique.
Net Asset Valuation
Theoretically, if the owners of a company decide to shut down the business, sell all assets and pay all liabilities, the amount of cash left on hand will be the net worth of the company. This Net Asset Value (NAV) is actually the Equity of the company from the balance sheet (and it’s also called Book Value).
Despite the logic behind the NAV, for most companies this valuation method is simply too conservative since it doesn’t take into account the value of the future growth of the company. Also, the new generation technological companies are making their profits from software or intangible assets, so the worth of their tangible assets doesn’t tell anything about their true value. For example, Facebook’s stock currently trades at $180, equal a market cap of $520 billions, almost 8 times larger than the book value of the company. This is because Facebook makes revenues of billions of dollars every year from advertisement on their site and not from any kind of Income-producing properties like buildings or factories.
Still, for traditional companies, mainly Real-estate or industrial companies or banks, the NAV is sometimes a good basic measurement for their valuation. This is what led Benjamin Graham, the father of value investing, to search for companies that are traded deeply below their NAV. Graham looked for companies whose market cap was less than two-thirds of their net current assets, that he defined as current assets minus all the liabilities of the company. He called these stocks Net-Net stocks. This strategy still works today, but it’s more difficult to find a net-net stock that fits Graham’s criteria.
Relative Valuation using multiples
One of the most common ways people are valuing assets is by relative valuation. This is based on the idea that, on average, companies that operates in the same field will have a similar valuation level. If they don’t, then either one is valued too high or the other one is valued too low.
As an example, on 2017 Nike earned $3.9 billion and is currently valued at $99 billion, which means it is traded at an Earnings multiple (Market Cap divided by Net Income, which is also called Price to Earnings multiple) of 25.5. Adidas is a similar leading show maker thus it should be valued at a similar level. Is it? Well, Adidas has earned around 1 billion Euros on the same period and is valued at 37 billion Euros, which means an earnings multiple of 27, close enough to Nike’s multiple.
There are many multiples used by investors where the most commonly used is indeed the Price to Earnings ratio (P/E) that we just presented, which is calculated by dividing the current share price by its net profit per share in the last 12 months. Analysts usually start by looking at the Earning per Share (EPS) of the company, thus love this multiple.
Other common multiples are the Price/Sales and the Price/Book Value. The first one measures the valuation of the stock based on its revenue in the last 12 months, and the second measure the valuation level compared to its Equity (Assets minus Liabilities), which is more adequate for companies that are valued based on their net asset value, such as real estate companies or banks.
Another multiple that I personally like, is the Enterprise Value to Earnings before Interest, Tax, Depreciation and amortization (EV/EBITDA). This is the best multiple for companies that have large depreciation expenses from assets they bought in the past. Depreciation is not a cash flow item and is only used in the Income Sheet to reduce tax payments, thus it make sense to add it back to the Operating Income to get a more representative measure of the company operating earnings.
The use of multiples to value stocks has become very common, maybe even too common, mainly because of the simplicity of using it. The problem is that a lower than industry multiple doesn’t necessarily mean that the company’s shares are traded at discount to fair value. Sometimes there is a good reason for low multiple, for example when investors are expecting earnings to shrink in the near future. Another limitation of the multiples valuation method is when the entire industry is traded at expensive valuations. In this case, even the stocks with lower than industry multiples will probably be expensive. In the 2000’s dot-com bubble, there were high-tech stocks that were traded at P/E ratios of 1000 and larger. Historically, the average P/E in the entire US stock market was around 15 and around 20 to technological companies, so dot-com high-tech stocks with P/E of 100 had lower than industry multiples but they definitely weren’t cheap.
To overcome these drawbacks, we need a more objective valuation method that is capable of valuing the business itself, not only compare it to other companies’ results. Such method is the Discount Cash Flow valuation that we present in the next chapter.
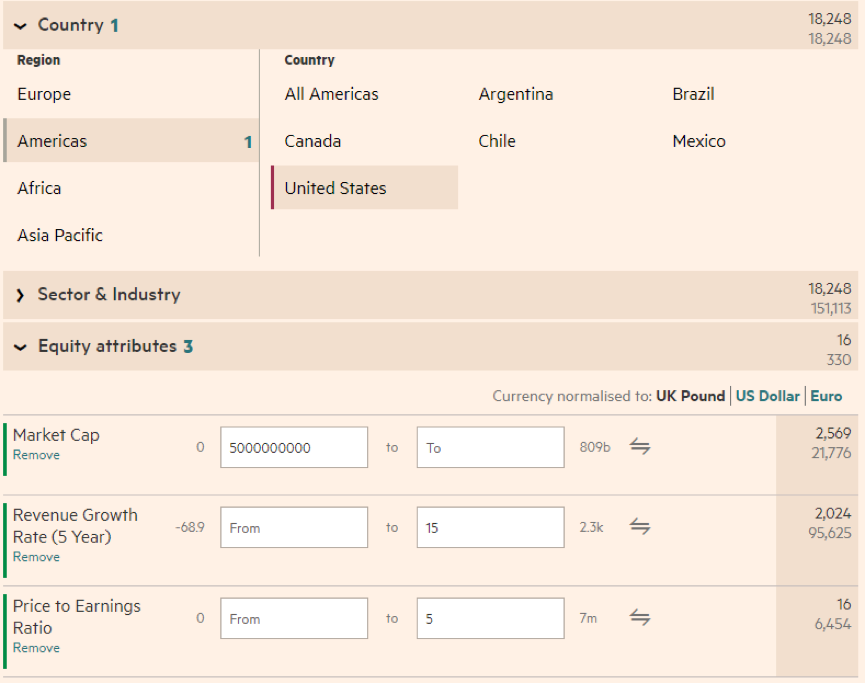
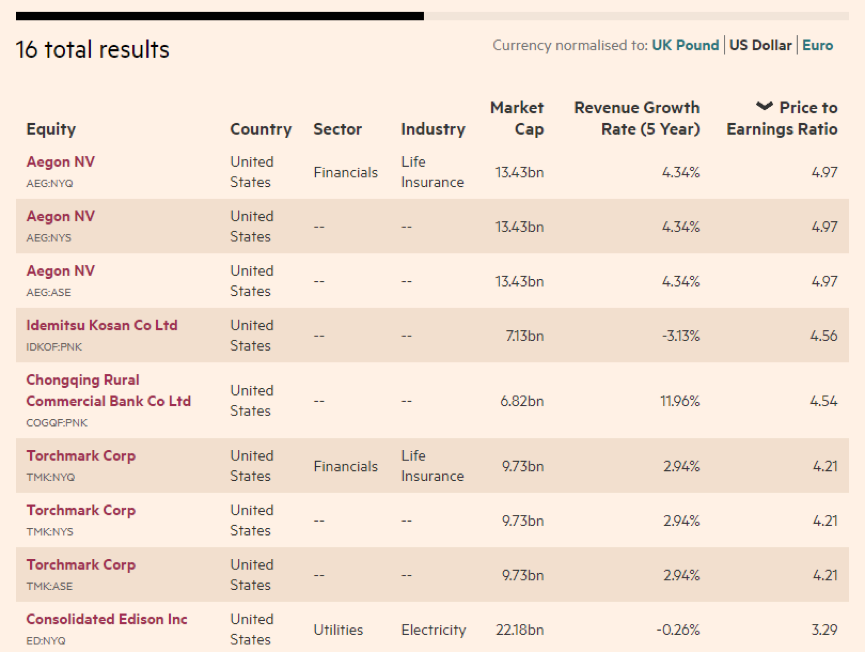
Still, since stocks with lower multiples have potential to trade at discount, they are very useful to screen for investment ideas. This is done by Stock Screening tools, and there are many of them in financial sites, most are free to use. One of the best is ft.com, which has a relatively good stock screener with lots of screening criteria. For example, if you are interested only in large growing US companies (a market cap above 5 Billion dollars) that might trade cheaply, you can screen for those who grew their revenues by 15% or more but are currently traded at P/E lower than 5. It yields 16 stocks that you now have to thoroughly analyze and value with the third valuation method that will be considered in the next chapter –
The discounted cash flow method.
Read on to the next chapter: