The U.S. just had one of its worst days of COVID-19 deaths since April, 56 million Americans have filed for unemployment and the presidential election is less than three months away. At the same time, the stock market just had its best 100-day run since 1933.
Did the market climb too high?
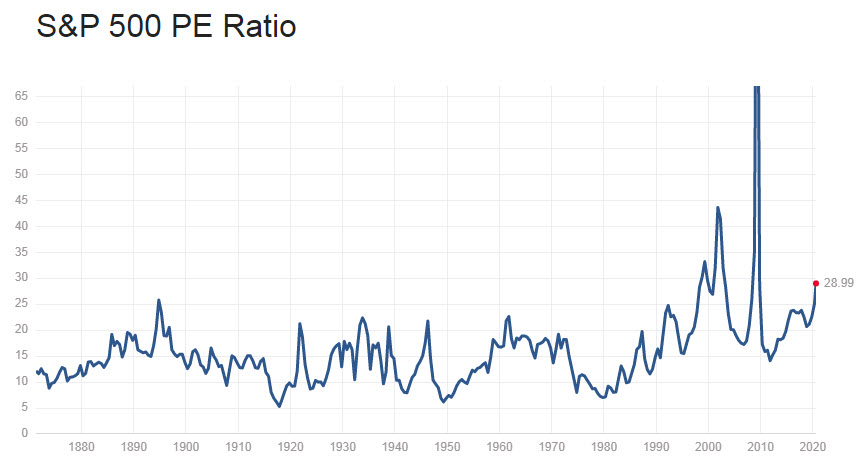
The most popular indicator that analysts like is the Price to Earnings (P/E) multiplier which compares the price of stocks to their company’s earnings.
The current P/E of the S&P500 is 29. It’s lower than the bubbly P/E of the dotcom era, but it’s much higher than the historical average multiplier of about 15. Even if we count only the values of the 21st century, the average is much less, about 20.
The P/E has many limitations but other indicators also hint the market might be overvalued. Take the ‘Buffett Indicator’ for example.

This is the favorite indicator of Warren Buffett to measure market valuation. It compares the world’s total gross domestic product (GDP) to the market capitalization of all stocks in the world. When the ratio is higher than 100%, it means the global economy isn’t keeping up with investors’ optimism, hinting that stock prices went too high too fast.
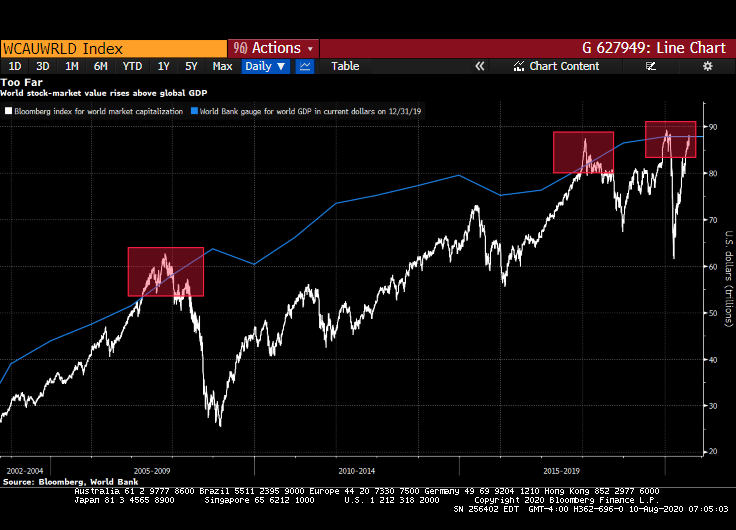
Recently, the market value of all public companies just crossed above the global GDP. In previous times when it happened – in 2001, in 2008, in 2018 and in February 2020 just before the Coronavirus arrived, the market crashed.
Are we headed into another collapse?
It looks scary, but things are different this time. Yes, they are different, mainly because of the ultra-low interest rates.

In the previous market collapses, interest rates in the US were much higher. In 2001 they were above 6%, in 2008 5.5%, and the interest rate was around 2% in February 2020.
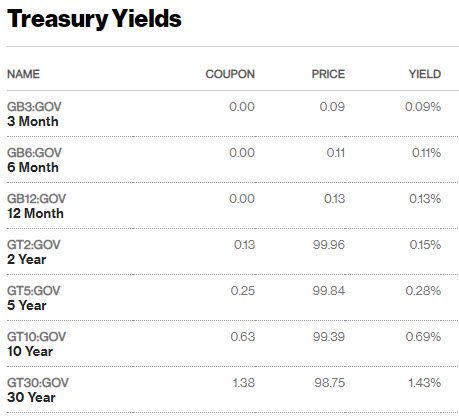
When interest rates are high enough, frightened investors are motivated to sell their stocks and buy bonds (mainly short-term US treasuries) which pay satisfactory yields. But in the current 0% interest rates environment, bond yields to maturity are too low.
Would you sell your stocks to lock your savings for 10 years in 10-year bonds that yield only 0.6% a year? You probably not, and most investors will do the same. This is why the stock market is the only place to get decent returns in the next few years.
But how high can the stock market continue climbing?
It’s a tricky question that no one can answer precisely. But as a rule of thumb, investors are willing to buy stocks when their earning yields are higher than bond yields to compensate for the higher risk involved in stocks.
Currently, the US 10-years treasuries are traded at a 0.6% yield to maturity. Will you buy a stock for a yield premium of 2.5% above bonds? If so, then you should buy the S&P500 stocks even if they trade at a P/E of 32 (P/E is the inverse of Earning Yield, thus 1/[0.6%+2.5%] = 32.2). If you are satisfied with a 2% premium above bonds like the average investor does, then even P/E’s of 38 and higher can be justified.
If you don’t believe the market can go there, just take a look at 2000, when stocks went up to P/E above 45, and it happened in a period when interest rates were much higher than today.
Stocks are the only game in town!
As mentioned before, the current P/E of the S&P500 is 29 might look “expensive” compared to its historical values, but when you take into account the 0% interest rate era that we’re in, you understand that the market is not bubbly and that stocks are poised to climb to new heights in the next few years. It doesn’t mean that the volatility will vanish, but it tells us that the positive trend of stocks will probably go on.

Be the first to comment on "Buffett Indicator: Where Are We with Stock Market Valuations?"