At the recent members’ conference, I presented my insights on the markets and how I think it should affect the allocation of our portfolio, if at all.
Here are the main points:
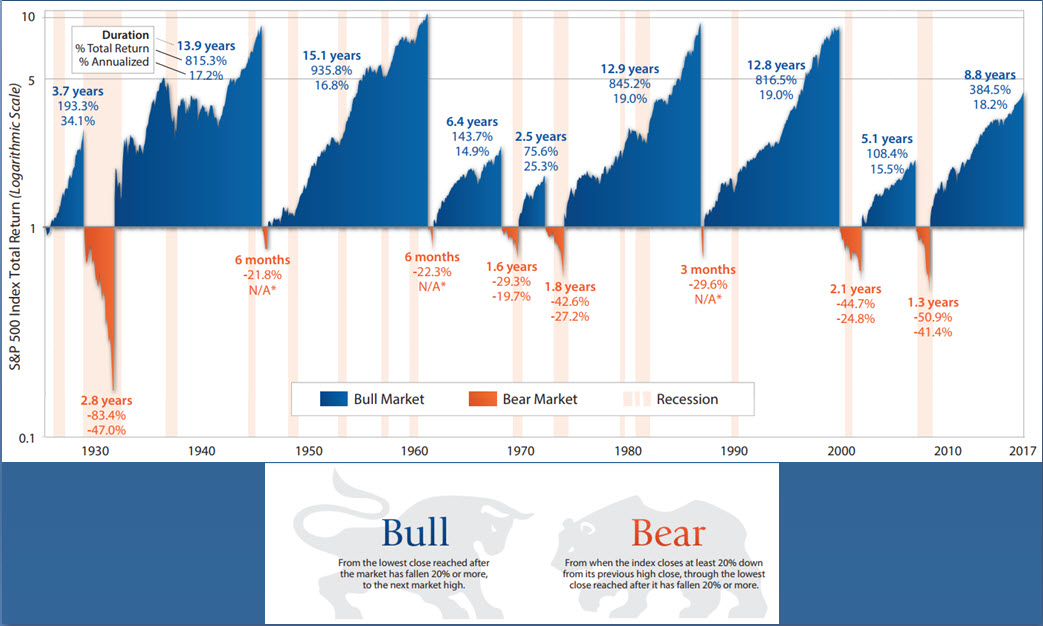
Although many feel that the current bull market is the longest in history, it turns out it isn’t. Since the bottom in March 2009, it has been almost nine years, which is quite a bit for the average bull market, but we have seen quite a few periods in the past in with longer and stronger rally. For example, the rally of the 70-80s and the rally of the dot-com bubble lasted nearly 13 years. Compared to these rallies the current one still looks young.
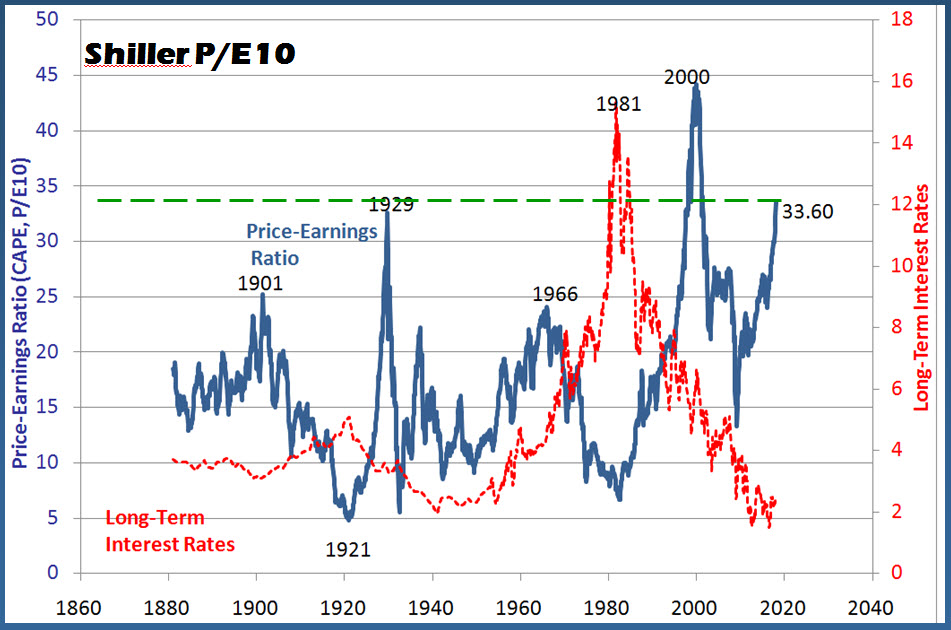
But in terms of valuations, things look different. For example, if you look at Professor Robert Schiller’s P/E 10 (the share price for each stock in the S&P500 divided by its 10-year average annual net earnings per share), you can see that the current valuation of the US stock market is only below the unusually expensive valuation at the peak of the dot-com bubble.
What is perhaps more alerting is that investors’ fear has almost disappeared recently. The VIX Index or its more familiar name, the Fear Index (a popular measure of the stock market’s expectation of volatility implied by S&P 500 index options) is at the lowest level ever. The last time we saw such a lack of fear was at the peak of the subprime bubble in late 2007 and I probably don’t need to remind you how it ended.

It must be admitted that there are shares whose high multipliers could be justified. Facebook, for example, almost doubled its EPS last year, so a 33.7 times P/E ratio is high but can be justified. On the other hand, there are companies that do not grow and there is no justification for such high multipliers.
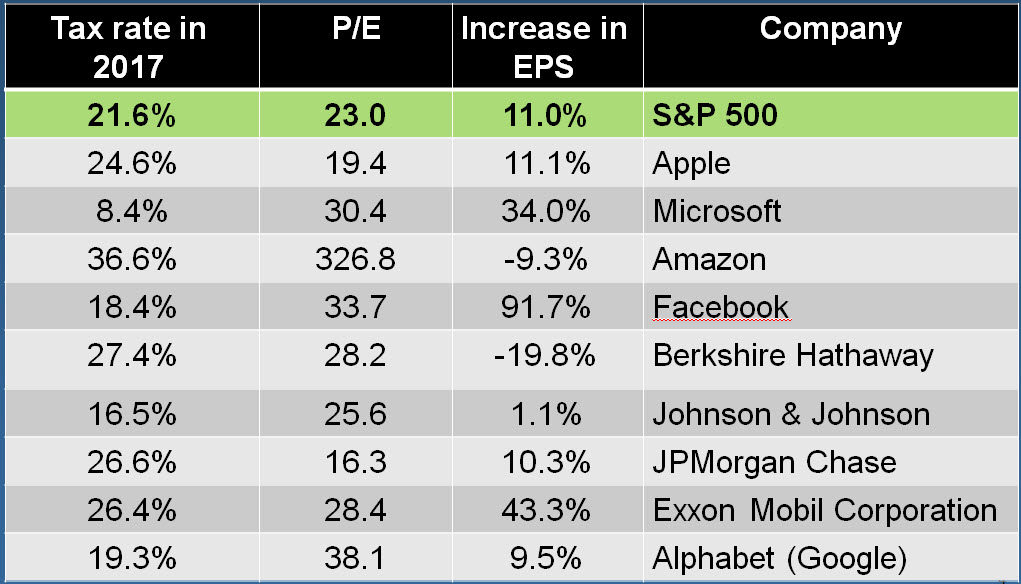
Consider Johnson & Johnson (JNJ), whose EPS has hardly increased in the past year, but is trading at a very high P/E of 25.6, which is adequate for a high-growth company. In fact, JNJ’s P/s multiplier is higher than 5, similar to its value at the peak of the dot-com bubble. This valuation seems extremely expensive.
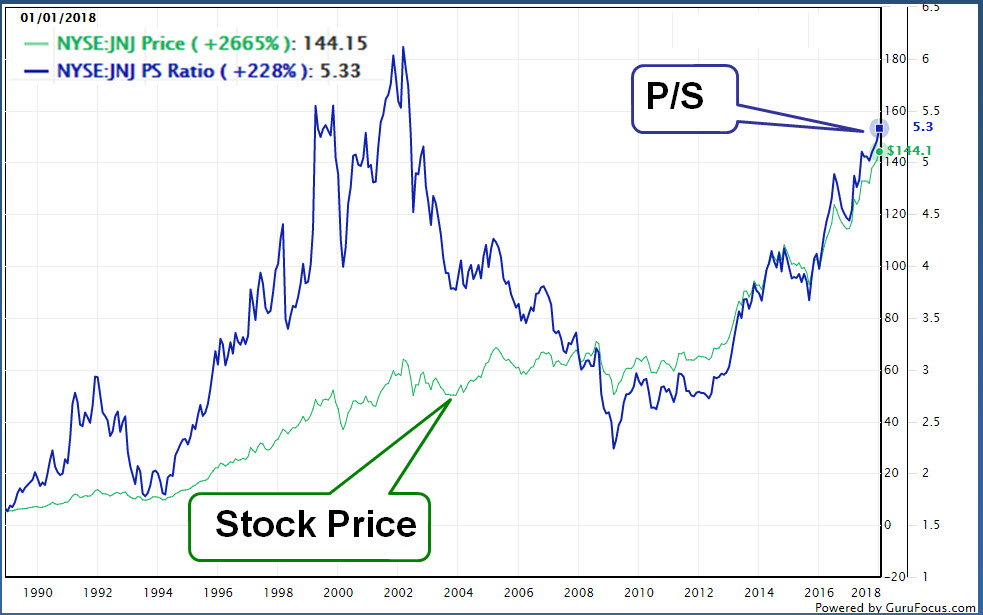
So what happened here? In one sentence, the price of large US stocks just rose much faster than the rise in their earnings per share.

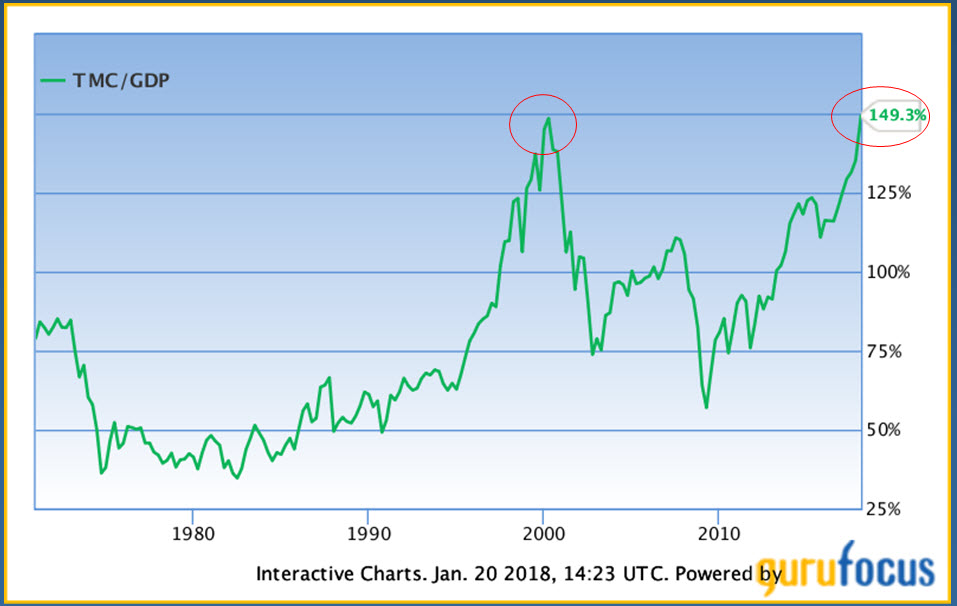
Warren Buffett was quoted as examining market valuation by dividing the total market capitalization of all US public companies by the US Gross Domestic Product (GDP). Historically, the market value of public companies was about 90% of GDP, and each time it was significantly higher the stock market was expensive and eventually fell down. Currently, the companies’ market cap is 49% higher than GDP. Such a high valuation according to this indicator was recorded only once in history – at the peak of the dot-com bubble. You have to admit it’s scary…

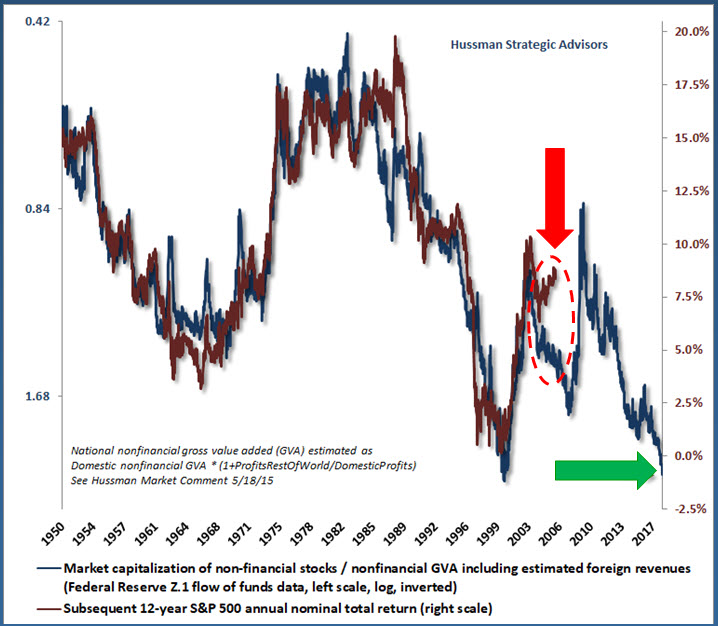
Here is another very strange thing happening in the market, probably because of the lack of fear of investors. Professor Hussman’s chart shows that there is a high correlation between the companies’ market cap to GDP (the blue line on the image below, with its scale on the right) and the average annual return of the S&P500 over the next 12 years.
Every novice investor knows that the higher the Market cap to GDP ratio (meaning the blue line is at a lower value on the chart), the more expensive the market is, so we expect it to yield a lower annual return later on. But in recent years (look under the red arrow) this correlation has been broken – the multiplier is rising (the blue line is falling) but the average return in subsequent years actually rises (the red line rises). This is an irrational market distortion, in which the valuation of the indices increases but those who buy later actually achieve higher returns.
Incidentally, those who believe in the correlation between these parameters see that whoever buys the S&P500 now will achieve an average annual yield of close to 0% in the next 12 years (see the value of the blue line on the right, near the green arrow).
All these indicators suggest that the US stock market is trading at a very expensive valuation. But we have forgotten something – the interest rate in the US is still very low on a historical level and this is probably not going to change dramatically in the near future.
Well, it is known that investing in stocks is preferable to investing in bonds when the earning yield of shares (the opposite of the P/E) is higher than long-term bonds yield to maturity. Historically, the spread between the stock earning yield (EY) to the yield of 10-year US treasuries was 2.6%. Recently, the 10-year bonds traded at a yield to maturity of 2.64%, meaning that the fair EY of the stock market is 5.24% or a P/E of 19.1. The current multiplier is 23.0, not significantly higher.
Even when interest rates rise in the coming years, the conclusion will not change dramatically. At the end of 2018, the Fed estimates that the interest rate will be 2.25% and rise to 2.75% at the end of 2019. If we compare the fair future multipliers (16.7 in 2018 and 15.4 in 2019) to the expected multipliers of analysts, the gap will not be too high either. Keep in mind that the interest rate may rise more slowly than the Fed’s forecast, and then the future fair multiplier will be higher and the gap will narrow. In other words, the US stock market is more expensive than its fair value, but there is no extreme valuation bubble, as some of the famous experts and investors claim.

Still, there are risks that cannot be ignored, and in recent days we have seen some of them already affecting the market negatively. The first of these is that US companies will not meet their expected growth forecasts and profit increase in the coming years. One of the drivers to expected improvement in companies’ profits this year is Trump’s tax reform’s impact. However, the average tax rate that the companies pay is already very close to the new tax rate (21%). Large, global companies even pay lower tax rates, so lowering taxes may turn out to be an illusion and nothing more.
Another risk is an increase in inflation beyond the government target range (3%). On the one hand, despite the huge quantitative easing programs around the world, I find it difficult to believe that we will see an inflationary burst as it was in the distant past. This is simply because the global economic environment is mainly deflationary. We are in an era of oversupply, frequent technological progress that reduces production costs, and commodity prices are still relatively low. On the other hand, the price of an oil barrel is already over $60, and the price of other commodities has returned to an upward trend in the past year, and this could lead to the breach of the Fed’s upper limit of inflation. In such a case, it would have no choice but to raise interest rates faster than it planned to stamp out inflation. This is something that investors are worried about in the last few days and it pushes stocks and bonds down.
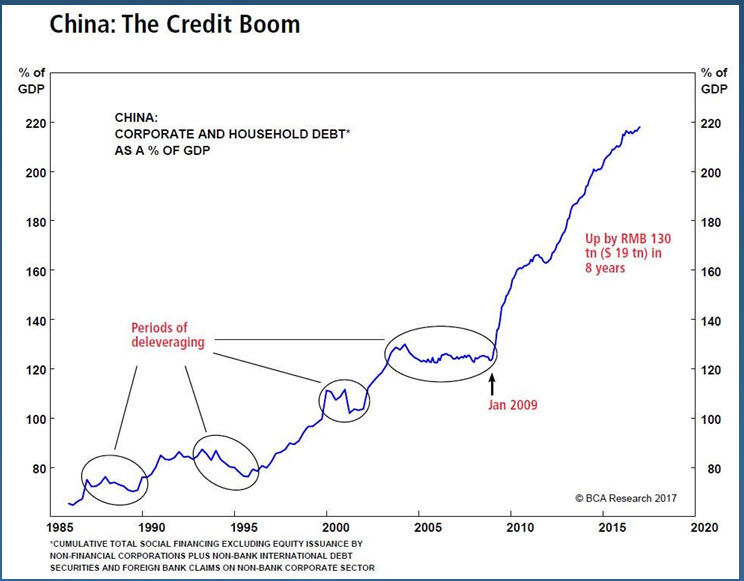
Another risk lies in the Chinese economy, which is one big black hole. Despite the Chinese government’s announcement of 7 percent growth in GDP in recent year, it is difficult to know the real economic-financial picture within the country. The problem is that China has developed a huge debt bubble in recent years that threatens the stability of its banking system. Actually, China is currently mostly financed by increasing debt, and this is a bad situation that cannot last forever.
Fortunately for the Chinese, they have very large reserves of gold and foreign currency that can help them remove a large part of the air from this bubble gradually, but no one can guarantee that there will not be any difficulties on the way which could cause increased volatility to the global stock market.
Another major risk lies in the bond market, especially in Europe. Most European economies now look much better than they did a few years ago, but this recovery is still supported by the central bank’s bond purchase program. The ECB buys €60 billion worth of bonds a month, which is a lot of money.
This huge volume of purchases has led the central bank to exhaust all the bonds of the strong countries, so in the past year, it has been forced to purchase bonds from both weak countries and lower-rated companies. This has created a severe pricing distortion in the European bond market, with bonds of weak and high-risk countries trading at a fairly low yield to maturity. An extreme example is two-year Greek bonds traded at a yield to maturity of 1.3%, which is even lower than the equivalent US bonds. The Greek economy is still bleeding, so it’s obviously an unreasonable valuation, even bubbly, all because the ECB created a high artificial demand for those bonds.
Unlike the situation in the US, where there is a reasonable secondary bond market, in Europe, there is no one to buy these bonds from the central bank when it wants to start selling them back to reduce its balance sheet. If the ECB starts raising interest rate in the eurozone, and if inflation is higher than planned, and this is not an unreasonable scenario, it could dramatically boost bond yields (i.e., their prices will collapse), and this will certainly have a negative impact on the stock markets as well.

So what’s the bottom line and how to invest this year?
In my opinion, the US stock market, as in many other places in the world, is traded at a relatively expensive valuation, but we’re not in a bubbly zone, yet. The fact that the interest rate is expected to remain low for several years is expected to leave investors in the equity channel so that the stock market will be able to continue in a positive trend. Naturally, every morning a black swan can pop up and spoil the party, but no one can predict when and where it will come. Therefore, the best advice I can give you is to continue investing as usual, according to the asset allocation that suits your needs and investing characteristics.
Don’t let the 2018 opening rally or the last few days negative trend affect your investing behavior. Investing is like running a marathon, so do not get excited if one of the runners suddenly starts sprinting. Of course, he could not keep it up for too long, so after a few miles he’d run out of strength and get tired. And then, we, that continue to run at our own pace and strategy, overtake it. That’s exactly what I estimate will happen over time to the portfolio against the indices.
And now as promised, as far as the portfolio’s composition, I think it makes sense to diversify the portfolio with:
- Value stocks trading below their intrinsic value. One a great example of a deeply undervalued stock is the insurance company NN Group.
- Growth stocks, for example look at the data center REIT CyrusOne.
- Few small stocks with significant potential, a great idea for that is the biotechnology company Aptevo Therapeutics.
- And to maintain a cash balance of about 20% to take advantage of new opportunities coming from time to time. This is exactly the composition of the portfolio on the site, so I think it is built in a suitable manner for the current period as well.
Have a successful and interesting year.

4 Comments on "How to invest wisely in 2018?"