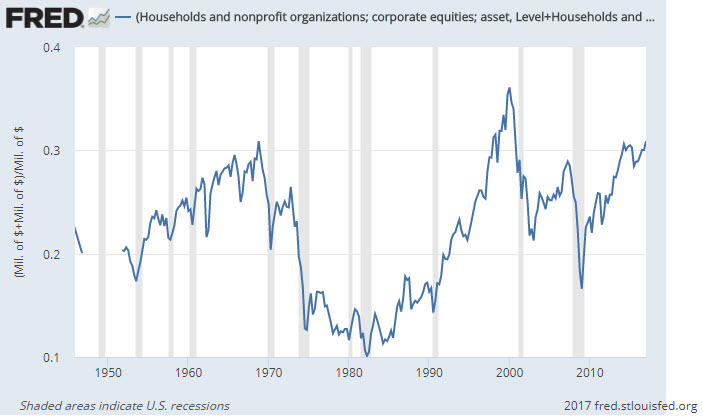
The stock market continues to climb and break records. Since the beginning of the year, US indices have already yielded double-digit returns (my spin-off portfolio in this site is already up 21.5% YTD). Even the real estate bubble in China and the credit problems of many companies in the country, or the warming between North Korea and the US in view of ballistic missile launch attempts, do not frighten investors. As a proof, the percentage of stocks in the portfolio of the average US investor has surpassed the 2007 peak level and is currently only below the unusually high percentage of stocks that was on the eve of the dot-com crash.
Investors’ lack of fear has led the markets to one of the longest rallies in history – over 8 years of a bull market (although on the way there were 2-3 times of declines of 10% -15% for a short period). The only two times in which a longer bull market occurred were in 1991-2001 (the dot-com bubble) and 1961-1969. These two positive periods ended in massive collapses. Is the next crash coming too?
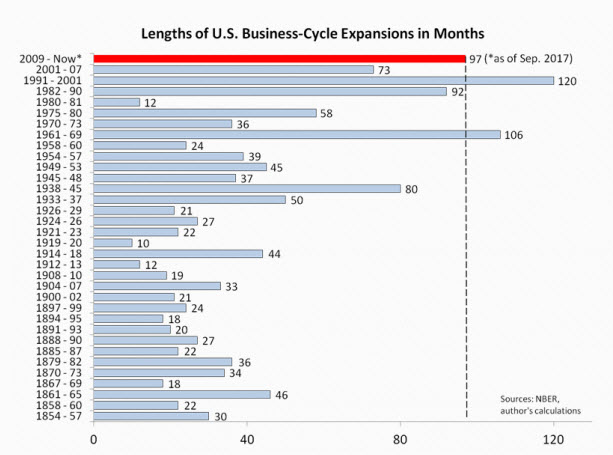
(Source)
Why does the stock market continue to rise?
Before discussing the future, let’s focus on the near-past and the present for a moment, during which there were (and still are) a large number of factors supporting the positive trend in the markets. Here are the main ones.
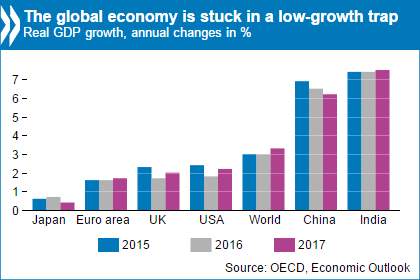
- Economic improvement in the world: The current macro-economic environment is full of troublesome problems, but we must admit that in recent years there has been a significant economic improvement, not only in the US, which gives backwinds to stocks.
(Source)
- The central banks are adopting a particularly expansionary monetary policy: The US Federal Reserve has purchased nearly $4 trillion in bonds since the 2008 crisis, and the European Central Bank has been following a similar path in recent years, buying $60 billion a month. Such quantitative easing is taking place in Japan as well, and these huge amounts of money reach companies and consumers through bank loans and encourage growth and consumption. This is a very good environment for stocks.
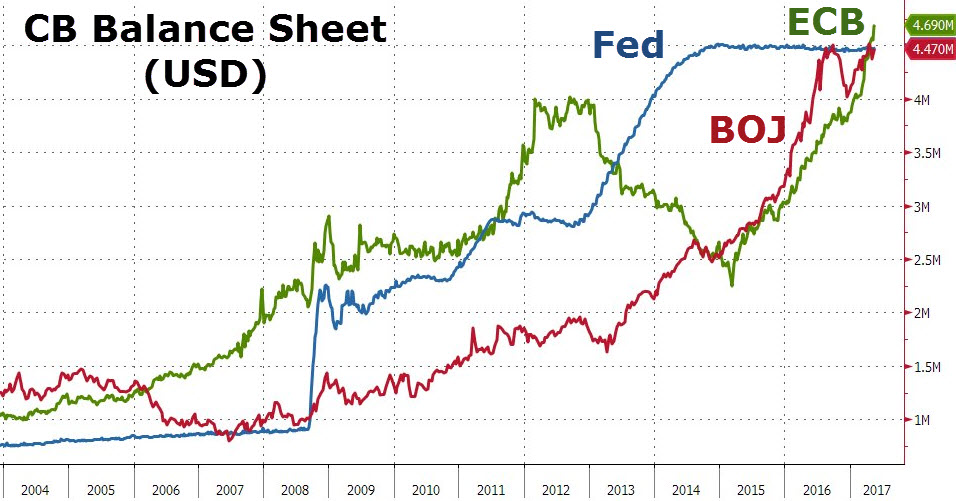
(Source)Is it artificially encouraging growth in the world? The Fed halted its bond buying plans two years ago, and since then the US economy has continued to grow and improve, but not at a very high pace. In Europe, the central bank seems far from finishing the quantitative easing program, so we can only get an answer for that in a few years. My guess is that when the European central bank announces a halt to the bond purchase program, it will “shake” the markets, especially bonds. However, this is probably still far from happening.
- Countries buy stocks: In the past, the countries of the world (through their central banks) invested only in the bond market, but in recent years many of them have also increased their exposure to the stock market. Whatever the reason, it is a relatively new phenomenon that, of course, gives a tailwind to the stock market.
- Deflation and low interest rates: Technological developments, which reduce production costs, together with the drop in shipping costs worldwide, have led to a global inflation-free environment. In recent years, there has been also a drop in commodity prices, which has even led to deflation in many countries around the world. When there is no inflation there is no need to raise interest rates. When the interest rate is low, yields on the bond market are low and the financing costs of the companies are low, making it easier to raise money and supporting higher multiples in the stock market.
- Lack of investment alternatives: As noted, the low interest rate and the large demand by central banks for government bonds and corporate bonds reduced bond yields to a historic low. Some of them are even traded with negative yields (yes you read correctly, investors buy bonds knowing they will lose money…). In the absence of investment alternatives, investors flock to shares, even at the expense of buying them in overvalued territory.
- Trump Optimism: Trump’s encouraging policy toward US companies through declarations of tax cuts, broad investment in infrastructure, regulatory easing, etc. has led investors to increase their growth and profitability forecasts for the next few years, pushing the shares to higher rates.
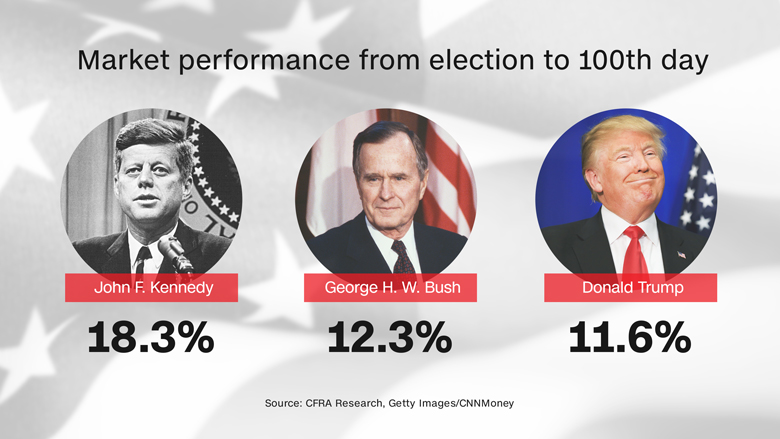
(Source)Will Trump really manage to execute all his plans? It’s hard to guess. However, most leading American companies already pay a lower tax rate than the corporate tax in the country, mainly because they are global, which accounts for a large part of their income through subsidiaries registered in countries where corporate tax is lower. Therefore, the tax cut will not have a special effect on their profits. The impact of regulatory easing is also limited, and it is reasonable to assume that in light of the many disagreements between the Democrats and the Republicans, we will not see real reforms here, at least not in the near future. Expect a disappointment for investors soon.
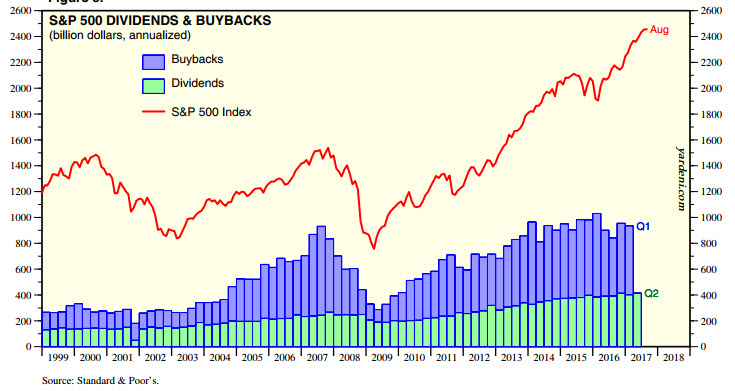
- Increase in Stock Buybacks: In recent years, most US companies have made massive purchases of their own shares. In some cases, there was justification for this as the stocks were undervalued, but in other cases, the goal was to artificially generate a larger net profit per share to satisfy investors and support the high share price. Some of the companies have even issued large loans (mainly through bonds) to finance these buybacks. Recently, the pace of purchases seems to be moderating somewhat, but it is still high, and this is one of the factors that give a boost to the stock market.
(Source)
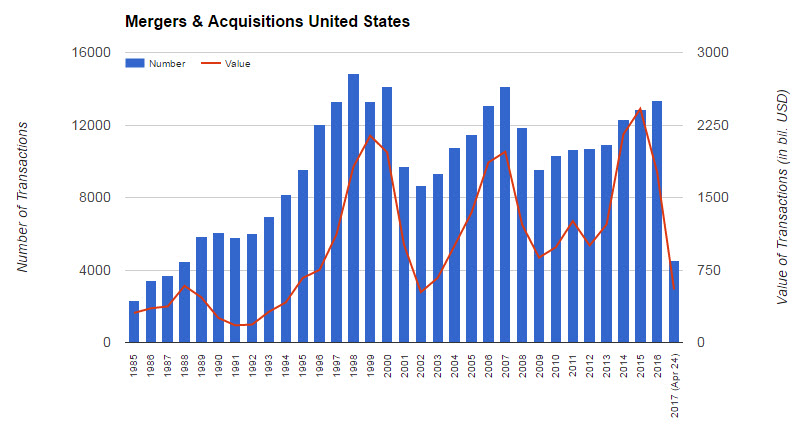
- Many mergers and acquisitions: When there is no growth and financing is cheap, you can take as many loans as you want and purchase your competitors. This is how growth is being generated easily and investors are happy. Also, mergers are usually made at a premium to the stock price of the acquired company, and here is another gust of wind for the stock market.
(Source)
- Running to indexes: Active investors like us, who selectively chose their stocks, are diminishing. Contrary, passive investors are growing in number, and move most of their investments to ETFs that track the indices, especially the leading indices. Also, the US Baby Boomers have a lot of money available for investment but a basic understanding of the stock market, so they tend to invest blindly in indexes and dividend stocks, regardless of the valuation. This huge demand is also driving up stocks that should not have risen on the basis of their financial results. Some argue that this makes indexes “inflated” and corrupts the capital market. There is certain a logic to this.

(Source)
- The growth of FAANG stocks (which for some reason were called FANG): Facebook, Apple, Amazon, Netflix and Google now account for 10.5% of the S&P500. This is equivalent to the weight of all 200 smallest companies in the index together. They also account for nearly half of the weight of the NASDAQ index. This is truly amazing!
 In recent years, the FAANG shares have been showing a tremendous rally, which increases the return of the indices. Without them, the indices would have risen much more moderate in recent years.
So is there a bubble in the stock market?
The stock market is not one piece. There are always stronger sectors that rise more than other weak sectors which rise less or even fall down. For example, the revolution being created by technology and Internet companies worldwide, which show remarkable growth each year, justifies a sharper rise in their shares. On the other hand, companies in the commodities sector, particularly in the energy sector, declined sharply in recent years, and this is also justified. Therefore, it is difficult to value the entire stock market together. Nevertheless, there are several common ways of estimating market price levels, particularly on the basis of historical comparisons of the multiples in which the shares are traded.
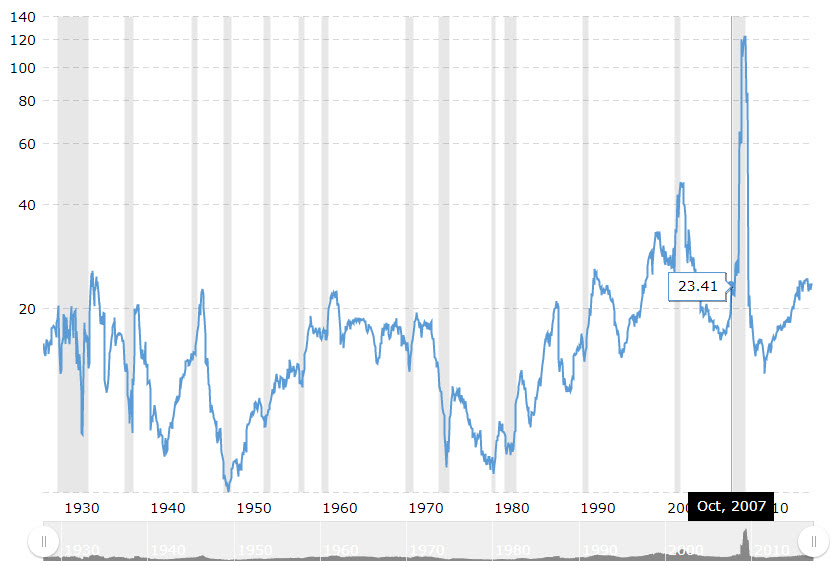
If we look at the S&P500’s Price to Earnings (P/E), which represents the US stock market pretty well, it currently stands at 23.5, which is 50% higher than the historical average, and the same value as the P/E on October 2007, just before the Sub-prime crisis started.
(Source)
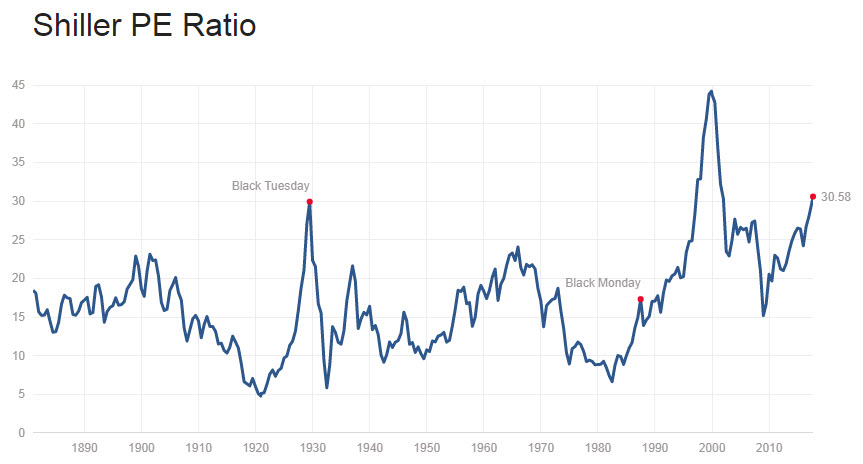
A slightly more reliable parameter for examining companies’ profits versus their value is Professor Schiller’s 10-year earnings multiplier (calculated by dividing the market cap by the average net profit over the past 10 years). It also shows a fairly high value (30.5). In fact, there were only two times in history in which the market approached such a high multiplier (Black Tuesday in 1929 and the dot-com bubble in 2000). According to these pricing parameters, investors’ irrational exuberance has led the stock market to very expensive pricing.
(Source)
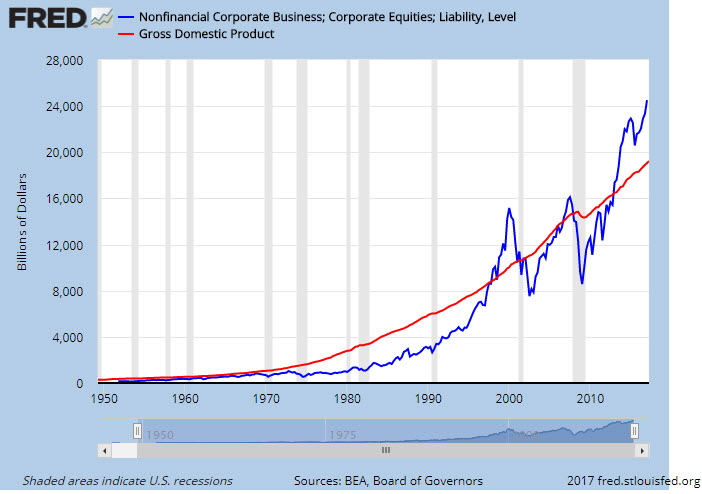
Although it is possible to gain insight regarding market valuation by using multiples based on net profit, their disadvantage is that different companies pay different interest rates and different tax rates, and therefore the result of the profit multipliers are distorted. A more rational way of examining the valuation level of the entire US stock market is by comparing the aggregate market cap of all public companies to gross domestic product (GDP, which, in general, represents the sum of products and services produced within the US). Buffett called this ratio as “probably the best single measure of where valuations stand at any given moment.” This is, in fact, a weighted Price to sales multiplier of the US stock market (by the way, this ratio is not useful to most other countries because the percentage of the public companies is too small, unlike in the US).
As we know, there is a correlation between the growth in sales of US companies (the increase in GDP in our case) and the value at which they are traded, so in a state of equilibrium (or if you want, when the stock market is priced correctly), companies valuations should rise in accordance to the rise in GDP. In other words, there may be certain periods in which the profits of public companies will increase more than the other elements that are counted in GDP, and therefore their value will rise more, but this cannot happen over a long period of time. Why? Because the rapid growth of the public companies will grow faster than the purchasing power of consumers, thus creating an excess supply that will decrease products prices. Then, companies will slow down and their growth will decrease back to the GDP growth rate.
Today we are probably in a temporary period of such an imbalance – the total market capitalization of US public companies stands at $23.6 trillion, 23% higher than the US economy ($19.2 trillion as of the end of the second quarter of 2017). This is a higher valuation than what we saw in October 2007, and only lower than the peak level of the dot-com bubble. (By the way, in most sites that calculate this ratio, for example here, you’ll see a higher value because they include the shares of foreign companies traded on Wall Street in their Total Marker Cap calculation, which is wrong as the sales of the foreign companies are not included in the US GDP, of course …).
Some investors argue that today’s market is very different from the stock market in the past, so it is necessary to make several adjustments to the calculation in order to be reliable (see here, for example). It should also be remembered that the inflation environment and the low interest rates we see today are completely different from the conditions we saw in the previous two bubbles, and that too must be taken into account when performing the calculation. The point is that, just like Schiller’s 10-yrs P/E and other average valuation tools, the ratio of market cap to GDP does not presume to predict whether we are near a market peak, but historically, it has proved to be a good predictor of stock market performance in the more distant future. This time, my gut feeling is that the high ratio does not lie, and the returns in the coming years are expected to be lower than the historical average. Still, I don’t see a market collapse in the near future (but an unexpected black swan can always come and affect the market direction…).
Since these ratios cannot be used to time the market, we should continue investing as usual. This means that when I find a stock that is traded below its fair value, I buy it no matter what value the market cap to GDP ratio shows. Even Buffett said it when he was asked if this ratio affect Berkshire Hathaway stock selection route.
Will the bull market end soon?
I do not have a crystal ball to predict the future, so any short-term forecast of me or any other investor will be a gamble only (and gambling I leave to the casino…). Still, if I have to guess, even if the market is trading in a relatively expensive territory (but not bubbled) there are a number of factors that will continue to support its bull trend in the foreseeable future.
First, the low interest rate environment in the world is expected to remain with us for many more years, simply because there is no inflation. The combination of globalization that lowers shipping prices, technological developments that reduce production costs and the transition to online purchase through price comparison sites will continue to lower product prices so that inflation will stay low. Of course, after a sharp decline in commodity prices, there must be a certain correction that will slightly raise inflation but not dramatically. Therefore, even in the US, the interest rate will not rise too sharply in the coming years (the FED is too optimistic in my view), which means that bond yields will continue to be unattractive, the multiples in the stock market will continue to be high and attract more investors toward stocks.
The laws of the economy have not changed, but we have changed our consuming behavior, and it changes the world. Today, the global economy is increasingly based on large technology and Internet companies that have a leaner capital structure, higher operational efficiency, and greater growth potential than those of the old world and the countries in which they operate. This boom will lead to their stocks continuing to push the indices up, even if the “old” companies grow slowly and slightly.
Despite the high holding rate of stocks in the average US investor’s portfolio, there is still a lot of cash out there. It also involves billions of dollars of sophisticated investors, including Buffett and many other successful hedge fund managers. If the market continues to move up, they will have no choice but to join the party and this will give an additional tailwind to the markets.
As for the central banks, the Fed has already announced its intention to start selling the huge bond portfolio it has accumulated over the past eight years, and the European Central Bank has a problem, as it is already close to the point where it will not have any bonds available for purchase. However, you can guess that no Central Bank will want a collapse of the market during his term, so they will do anything to support the high asset valuations that exist today. It won’t be easy, but if they want they will find the creative solutions to support the markets.
Should you continue investing as usual or start defending against the next market collapse?
When Warren Buffett is asked what he thinks about this subject, he answers that investors should continue to invest in stocks as usual. But immediately he adds that today it is much harder to find investment ideas attractive enough. This is reflected in Berkshire’s huge cash position which has crossed the $100 billion threshold recently. The company has a $150 billion equity portfolio so that now nearly 40% of Buffett’s money is “lying” in the bank and not invested in the stock market. It’s a cash position record of all time.
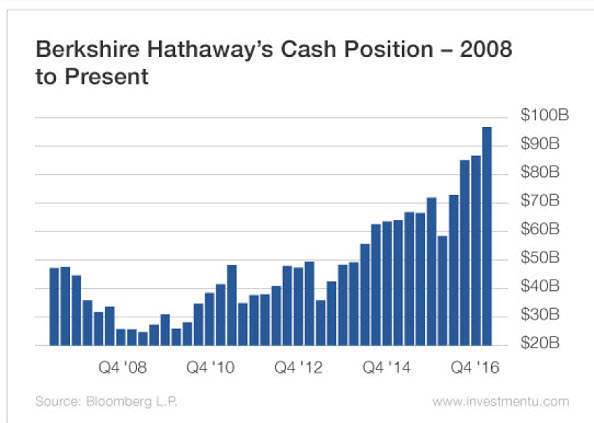
(Source)
We, the small investors, have a big advantage over Buffett and huge hedge funds, since among the smaller and medium-sized stocks there are still attractive investment opportunities. Still, in my opinion at the current valuation level, it makes sense to hold a cash balance of between 15% -20% in a rational stock portfolio. This will enable us to strengthen positions in shares that we hold and enter into new positions that will arise from time to time.
If the markets continue to skyrocket to an extreme overvaluation, it would be wise to consider buying more active insurance against declines in the form of put options on the main indices or on the shares of leading companies that are overpriced (and I have some of those in my sights). When the time comes, I’ll update you. Until then, we will continue to enjoy the rise in the market.


5 Comments on "Not bubbly but expensive – Time to exit the Stock Market?"